
A series of graphs drawing on Office for National Statistics data have gone viral on social media ahead of this week’s local elections, illustrating how immigration to the United Kingdom changed following Brexit. The core finding – that total net migration rose sharply after Britain left the European Union, driven by a dramatic increase in non-EU arrivals – is supported by official data. But the full picture is considerably more complex than the shareable charts convey.
Here is what the data actually shows, what drove the numbers, and why the picture has changed significantly since the peak.
What the data shows: the headline numbers
Net migration to the UK peaked at 944,000 in the year ending March 2023, with total immigration at 1,469,000 and emigration at 525,000. That figure represents the difference between the number of people who arrived in the UK to live for more than 12 months and the number who left.
For context, net migration in the year ending June 2016 – the year of the referendum – was approximately 336,000. EU citizens made up a majority of immigration and net migration in the run-up to the 2016 EU referendum.
What changed after Brexit was not the total number coming in but the composition of who was coming. EU immigration started to fall after the June 2016 referendum, and dropped sharply following the end of the Brexit transition period on 31 December 2020. Non-EU immigration steeply increased after the new immigration system was introduced at the start of 2021, rising from around 300,000 to over one million during the year ending September 2022.
Why non-EU migration surged
The post-Brexit points-based immigration system – introduced by Boris Johnson’s government on 1 January 2021 – replaced freedom of movement with a single framework applying equally to EU and non-EU nationals. What it also did, by design, was open up routes for non-EU workers that had not previously existed at scale.
The sharp rise in net migration is explained almost entirely by a significant increase in non-EU immigration. Between June 2020 and June 2023, net migration rose from 111,000 to 906,000.
The ONS and the Migration Advisory Committee have identified the main categories driving the increase. The post-Brexit immigration system, with relaxed salary thresholds and an expanded Health and Care Worker visa route, coincided with post-pandemic economic recovery, boosting demand for workers and students.
Study-related visas were the single largest category, accounting for nearly 40% of non-EU immigrants in the year ending June 2023. Work visas – particularly health and care worker visas and their dependants – were the second largest contributor. Humanitarian routes for Ukrainians following Russia’s invasion also contributed significantly to the figures, with the ONS revising its 2023 estimates upwards to account for previously undercounted Ukrainian arrivals.
UK in a Changing Europe, the research group that analyses Britain’s relationship with Europe, corroborated this picture. Non-EU employment reached approximately 225% of its 2016 level by the end of 2024, increasing the number of non-EU employees by approximately 992,000. The group concluded that “Brexit substantially reduced EU-origin employment and substantially increased non-EU-origin employment” and that “leaving the EU did not resolve” the dilemma created by ageing populations and demand for migrant labour.
What has happened since the peak
Following a boom and bust in migration levels under the previous government, net migration to the UK dropped to pre-Brexit levels of around 200,000 in the year ending June 2025, a decline of 720,000 over the previous two years from a peak of over 900,000.
The fall was driven primarily by policy changes introduced by the Conservative government in late 2023 and early 2024 – most significantly, restrictions on international students bringing family members to the UK and increases in the salary threshold for skilled worker visas. Among non-EU migrants, the decrease in net migration was driven by work and study migration, which declined by 70% and 62% respectively.
Non-EU+ immigration decreased by 37% in the year ending June 2025 compared with the updated estimate for year ending June 2024.
The only major migration category where net migration did not decrease was asylum. Long-term immigration of asylum seekers was 96,000 in the year ending June 2025, making up 11% of all immigration – double the 5% share in 2019.
The important caveats
Several important caveats apply to the viral graphs and to the broader debate.
First, the ONS has acknowledged significant uncertainty in its post-Brexit migration statistics. The ONS’ current net migration statistics are badged as “experimental,” and from 2021 to 2023 the average magnitude of revision has been 178,000 – a 31% change from the initial estimate. The 2023 peak figure, now estimated at around 944,000, was originally published considerably lower before upward revisions were applied.
Second, the drivers of non-EU migration are multiple and not solely attributable to Brexit policy design. The post-pandemic economic recovery, the war in Ukraine, pent-up demand for study-related migration following Covid travel restrictions, and expanding health and care sector vacancies all contributed to the surge.
Third, the relationship between the stated goals of the Vote Leave campaign and the specific immigration policy choices made by subsequent Conservative governments is contested. The points-based system was a deliberate policy choice made by Boris Johnson’s government – one that, as the Migration Observatory at Oxford has noted, prioritised skills-based global migration over the previous EU-dominated model, with predictable compositional effects.
The political dimension
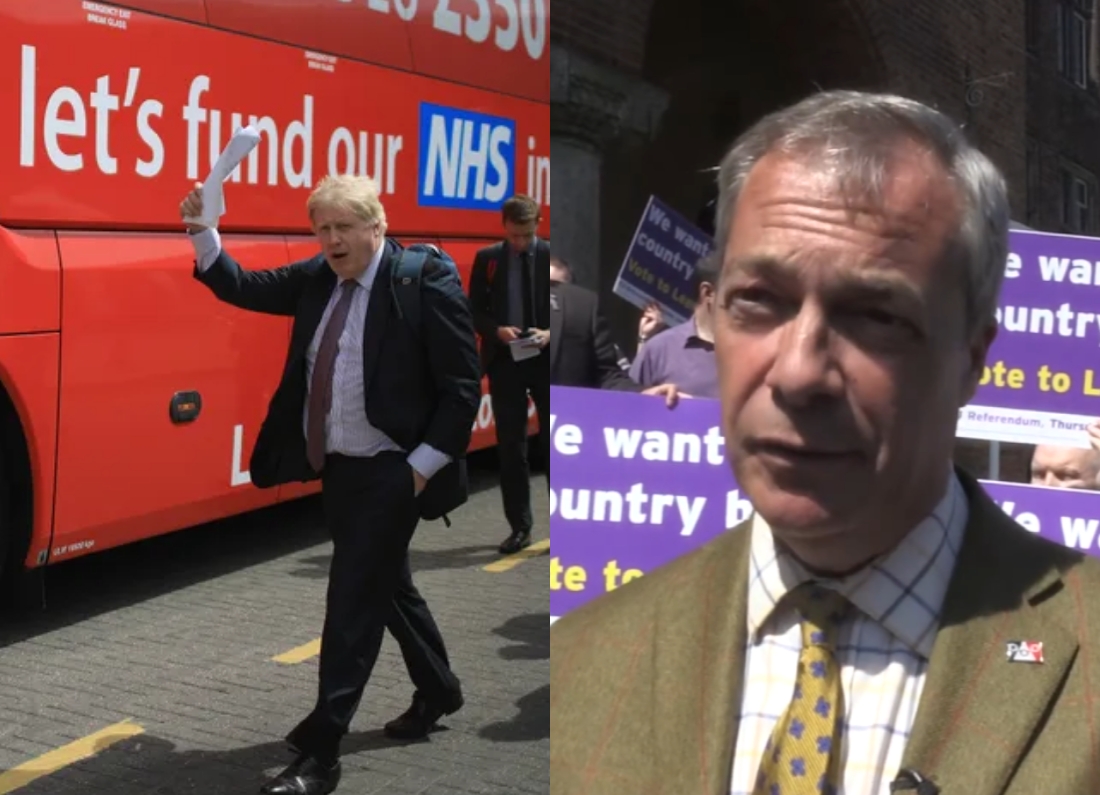
The graphs have circulated widely in the days before the May 7 local elections, in which both Reform UK and the Conservative Party have made immigration a central campaign theme. Both parties supported Brexit. Both are now calling for significant reductions in the immigration that followed it.
Reform UK is polling at 27% nationally, with immigration control among its most prominent policy commitments. Nigel Farage voted for Brexit, campaigned for Boris Johnson’s government and supported the points-based system that preceded the immigration surge. Reform’s position is that the current system requires wholesale reform. Critics argue the party is campaigning against consequences of policies it supported.
The Conservative Party, under Kemi Badenoch, similarly argues for stricter immigration controls while having governed for the entire period during which the record peaks were set. Labour points to its own immigration white paper, published in May 2025, which introduced new restrictions and is projected to reduce net migration to approximately 100,000 annually.
Whether any party’s current promises on immigration are more credible than the promises made before the referendum is a judgement voters will make on Thursday. The ONS data is available at ons.gov.uk and the Migration Observatory’s analysis is at migrationobservatory.ox.ac.uk for anyone who wants to look at the full picture rather than a social media graph.
You may also like: ‘So tweeting something stupid is disqualifying – but appointing a friend of Epstein is not?’ LBC presenter delivers the question Labour couldn’t answer


![Keir Starmer Unpacked: meeting world leaders to protect British interests [YouTube]](https://thedailybritain.co.uk/wp-content/uploads/2026/04/sirkeirstarmerapril26.jpg)